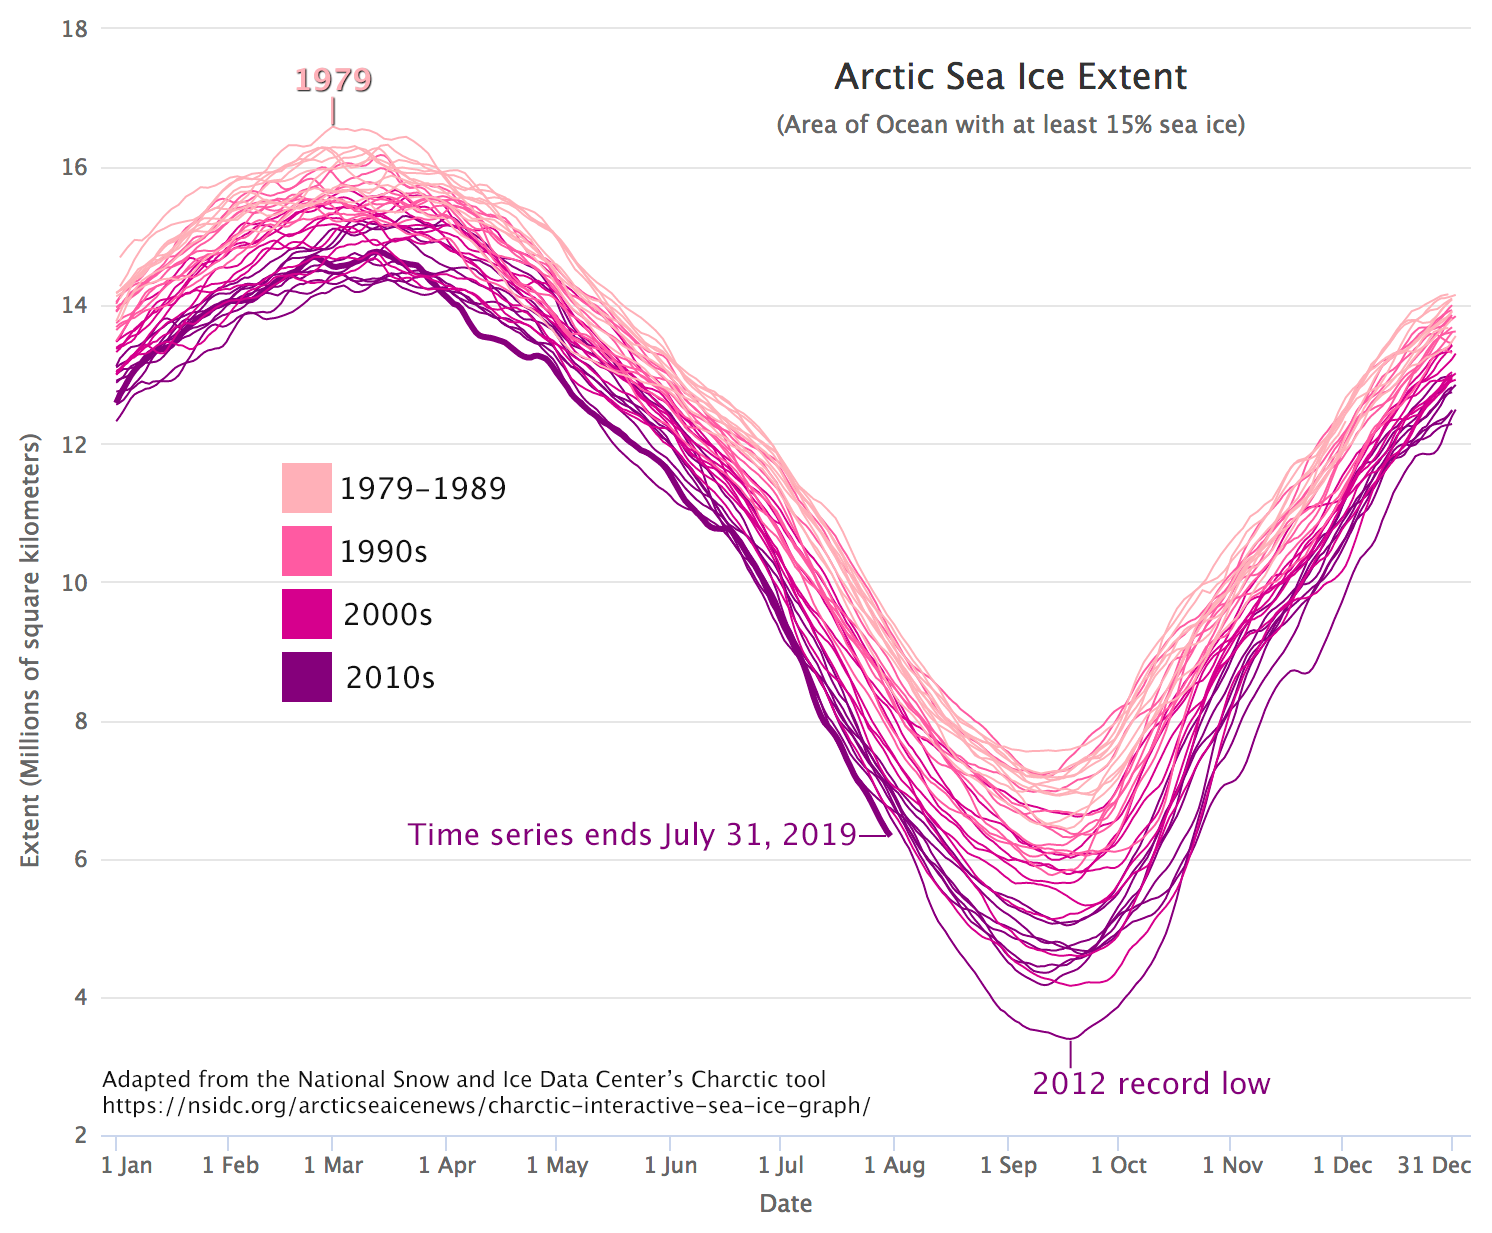
At mid-month, Arctic sea ice extent is tracking close to 2012, the year with the lowest minimum in the satellite record. Sea ice volume is also tracking at low levels. Smoke from Siberian wildfires continues to cover much of the Pacific side of the Arctic Ocean, but as solar input declines this late in the melt season, it is unlikely to impact sea ice loss.
Overview of conditions
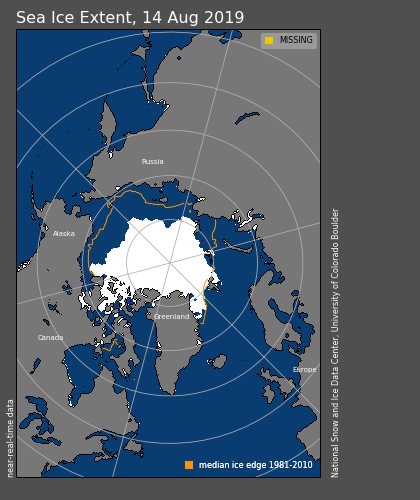
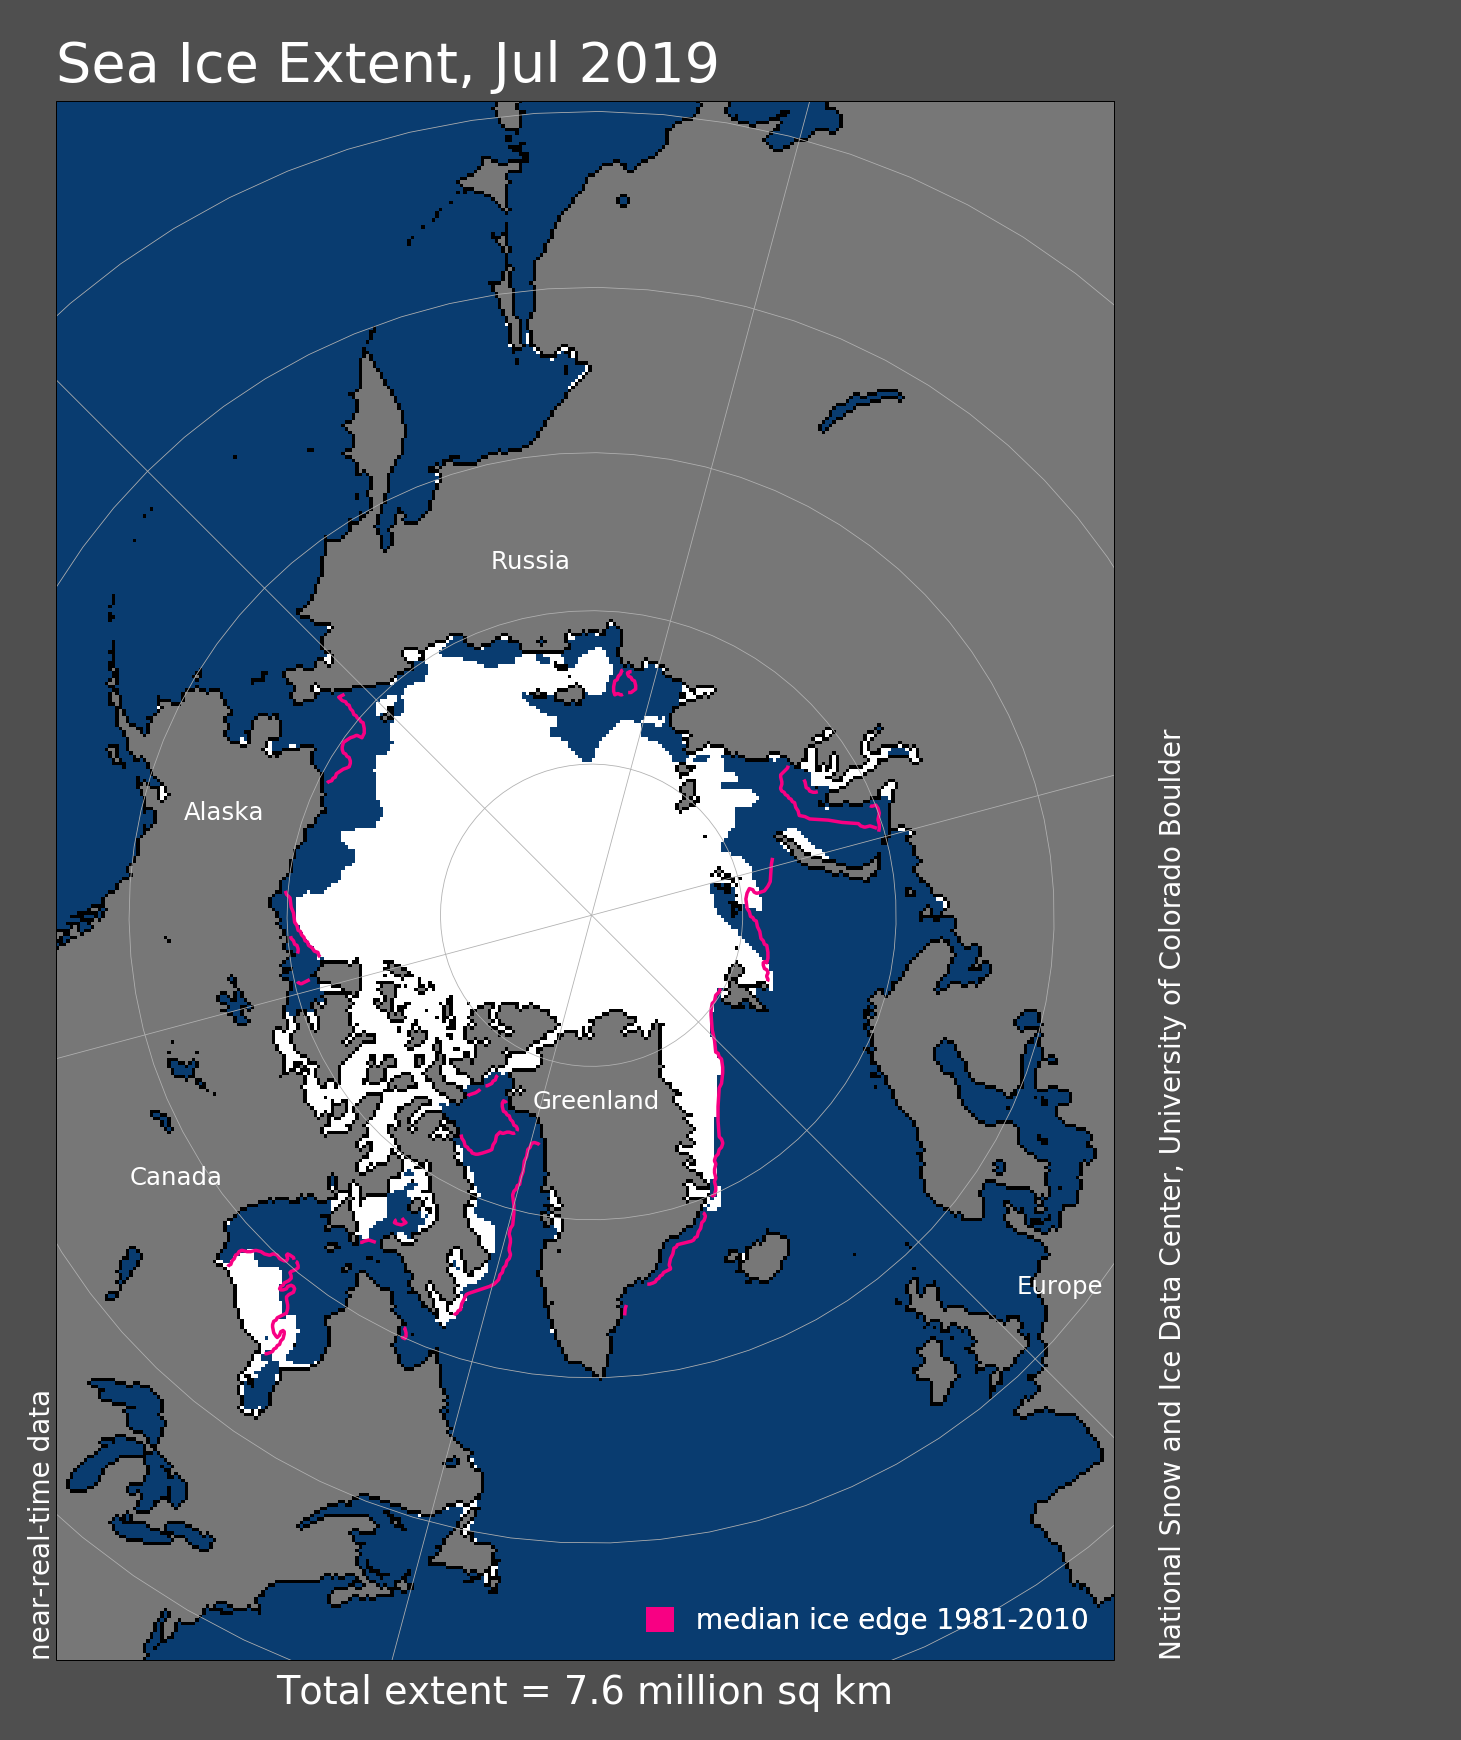
Figure 1a. Arctic sea ice extent for August 14, 2019 was 5.04 million square kilometers (1.95 million square miles). The orange line shows the 1981 to 2010 average extent for that day. Sea Ice Index data. About the data
Credit: National Snow and Ice Data Center
High-resolution image
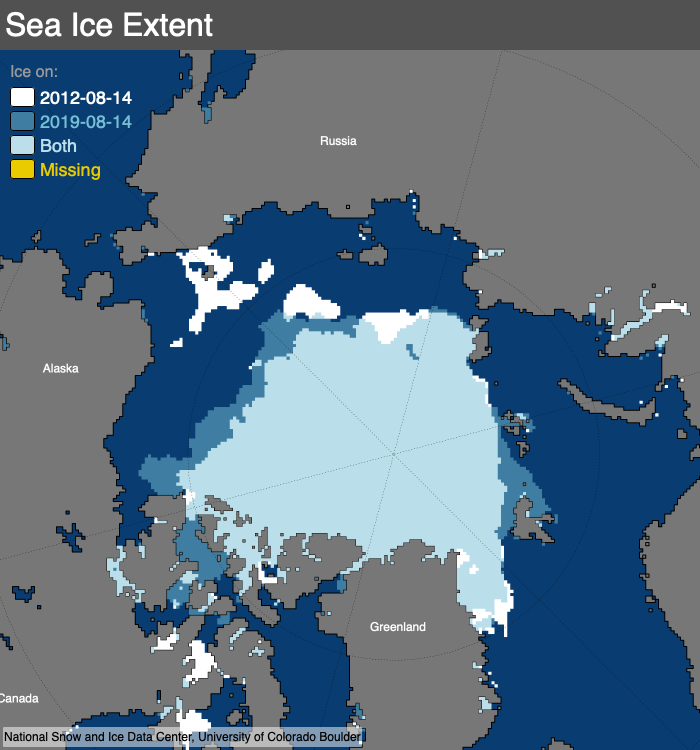
Figure 1b. This map compares Arctic sea ice extents between August 14, 2012 and August 14, 2019 from the NSIDC comparison tool.
Credit: National Snow and Ice Data Center
High-resolution image
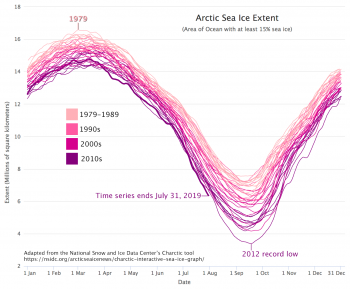
From August 1 to 14, sea ice extent declined at a daily rate of 91,000 square kilometers (35,000 square miles), still above the 1981 to 2010 rate of decline of 71,000 square kilometers (27,400 square kilometers) during this period. However, this is still below the decline of 112,000 square kilometers (43,000 square miles) per day observed in 2012. At the beginning of the month, the 2019 ice extent was well below 2012. Because the decline through August was slower, the 2019 and 2012 sea ice extents are now close to each other. Because 2012 is a leap year, and our tracking follows the day of the year, August 13 in 2012 is August 14 in non-leap years. The ice extent for August 14, 2019 is 5.04 million square kilometers (1.95 million square miles), approximately 100,000 square kilometers (38,600 square miles) higher than for August 14, 2012 (Figure 1a).
Sea ice retreat in the first half of August 2019 was mainly in an area of patchy sea ice in the East Siberian Sea and along the ice edge in the northern Beaufort and Chukchi Seas. The Northern Sea Route appears to be open in our satellite-based mapping, but ice may remain in some areas. The Northwest Passage is still closed. There was little change in the ice edge in the Svalbard region and northern Barents and Laptev Seas. However, areas of low sea ice concentration are present along much of the remaining ice edge.
A comparison of 2019 and 2012 ice extent for August 14 shows remarkable similarities. In 2012, some patchy ice remained in the east Siberian Sea; however, the ice edge in the northeastern Beaufort and northern Chukchi Seas was further north, and some larger channels in the Canadian Archipelago were open (Figure 1b).
Conditions in context
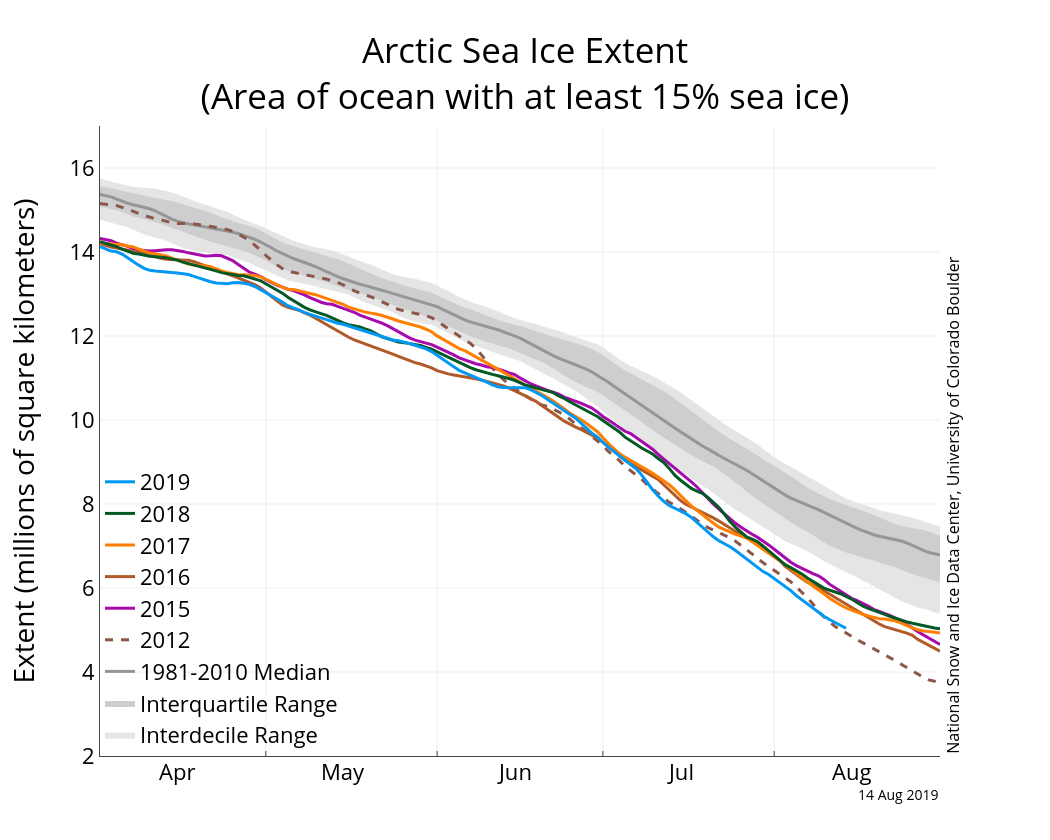
Figure 2a. The graph above shows Arctic sea ice extent as of August 14, 2019, along with daily ice extent data for four previous years and the record low year. 2019 is shown in blue, 2018 in green, 2017 in orange, 2016 in brown, 2015 in purple, and 2012 in dotted brown. The 1981 to 2010 median is in dark gray. The gray areas around the median line show the interquartile and interdecile ranges of the data. Sea Ice Index data.
Credit: National Snow and Ice Data Center
High-resolution image
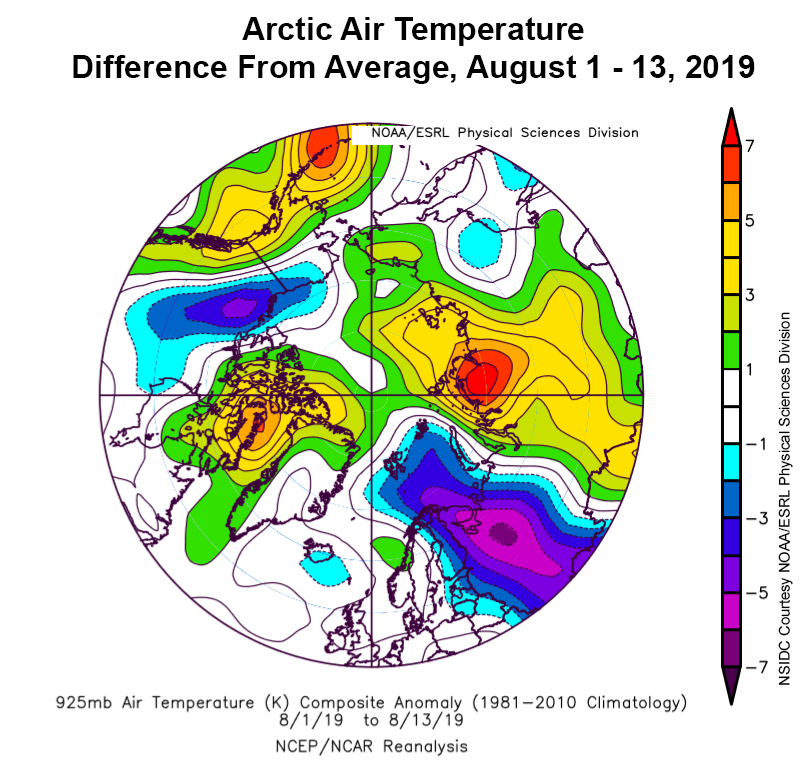
Figure 2b. This plot shows the departure from average air temperature in the Arctic at the 925 hPa level, in degrees Celsius, for August 1 to 13, 2019. Yellows and reds indicate higher than average temperatures; blues and purples indicate lower than average temperatures.
Credit: NSIDC courtesy NOAA Earth System Research Laboratory Physical Sciences Division
High-resolution image
Over the first half of the month, air temperatures along the Siberian coast at the 925 hPa level (about 2,500 feet above the surface) were generally 2 to 7 degrees Celsius (4 to 13 degrees Fahrenheit) above the 1981 to 2010 average, and 1 to 6 degrees Celsius (2 to 11 degrees Fahrenheit) above average over the Canadian Archipelago (Figure 2b). This was partly balanced by below-average temperatures in northern Scandinavia and the Kola Peninsula by 4 to 6 degrees Celsius (7 to 11 degrees Fahrenheit), a sharp counterpoint to the near-record heat of the late July European heat wave. Near-average temperatures prevailed over the central Arctic Ocean and slightly lower-than-average temperatures were present along the North Slope of Alaska and northwestern Canada. The atmospheric circulation was characterized by high pressure over the Northern Pacific, the Aleutians, and Greenland, and by a center of lower air pressure over northern European Russia. This combination drove cool Arctic air into Scandinavia and easternmost Russia.
Smoke gets in your ice
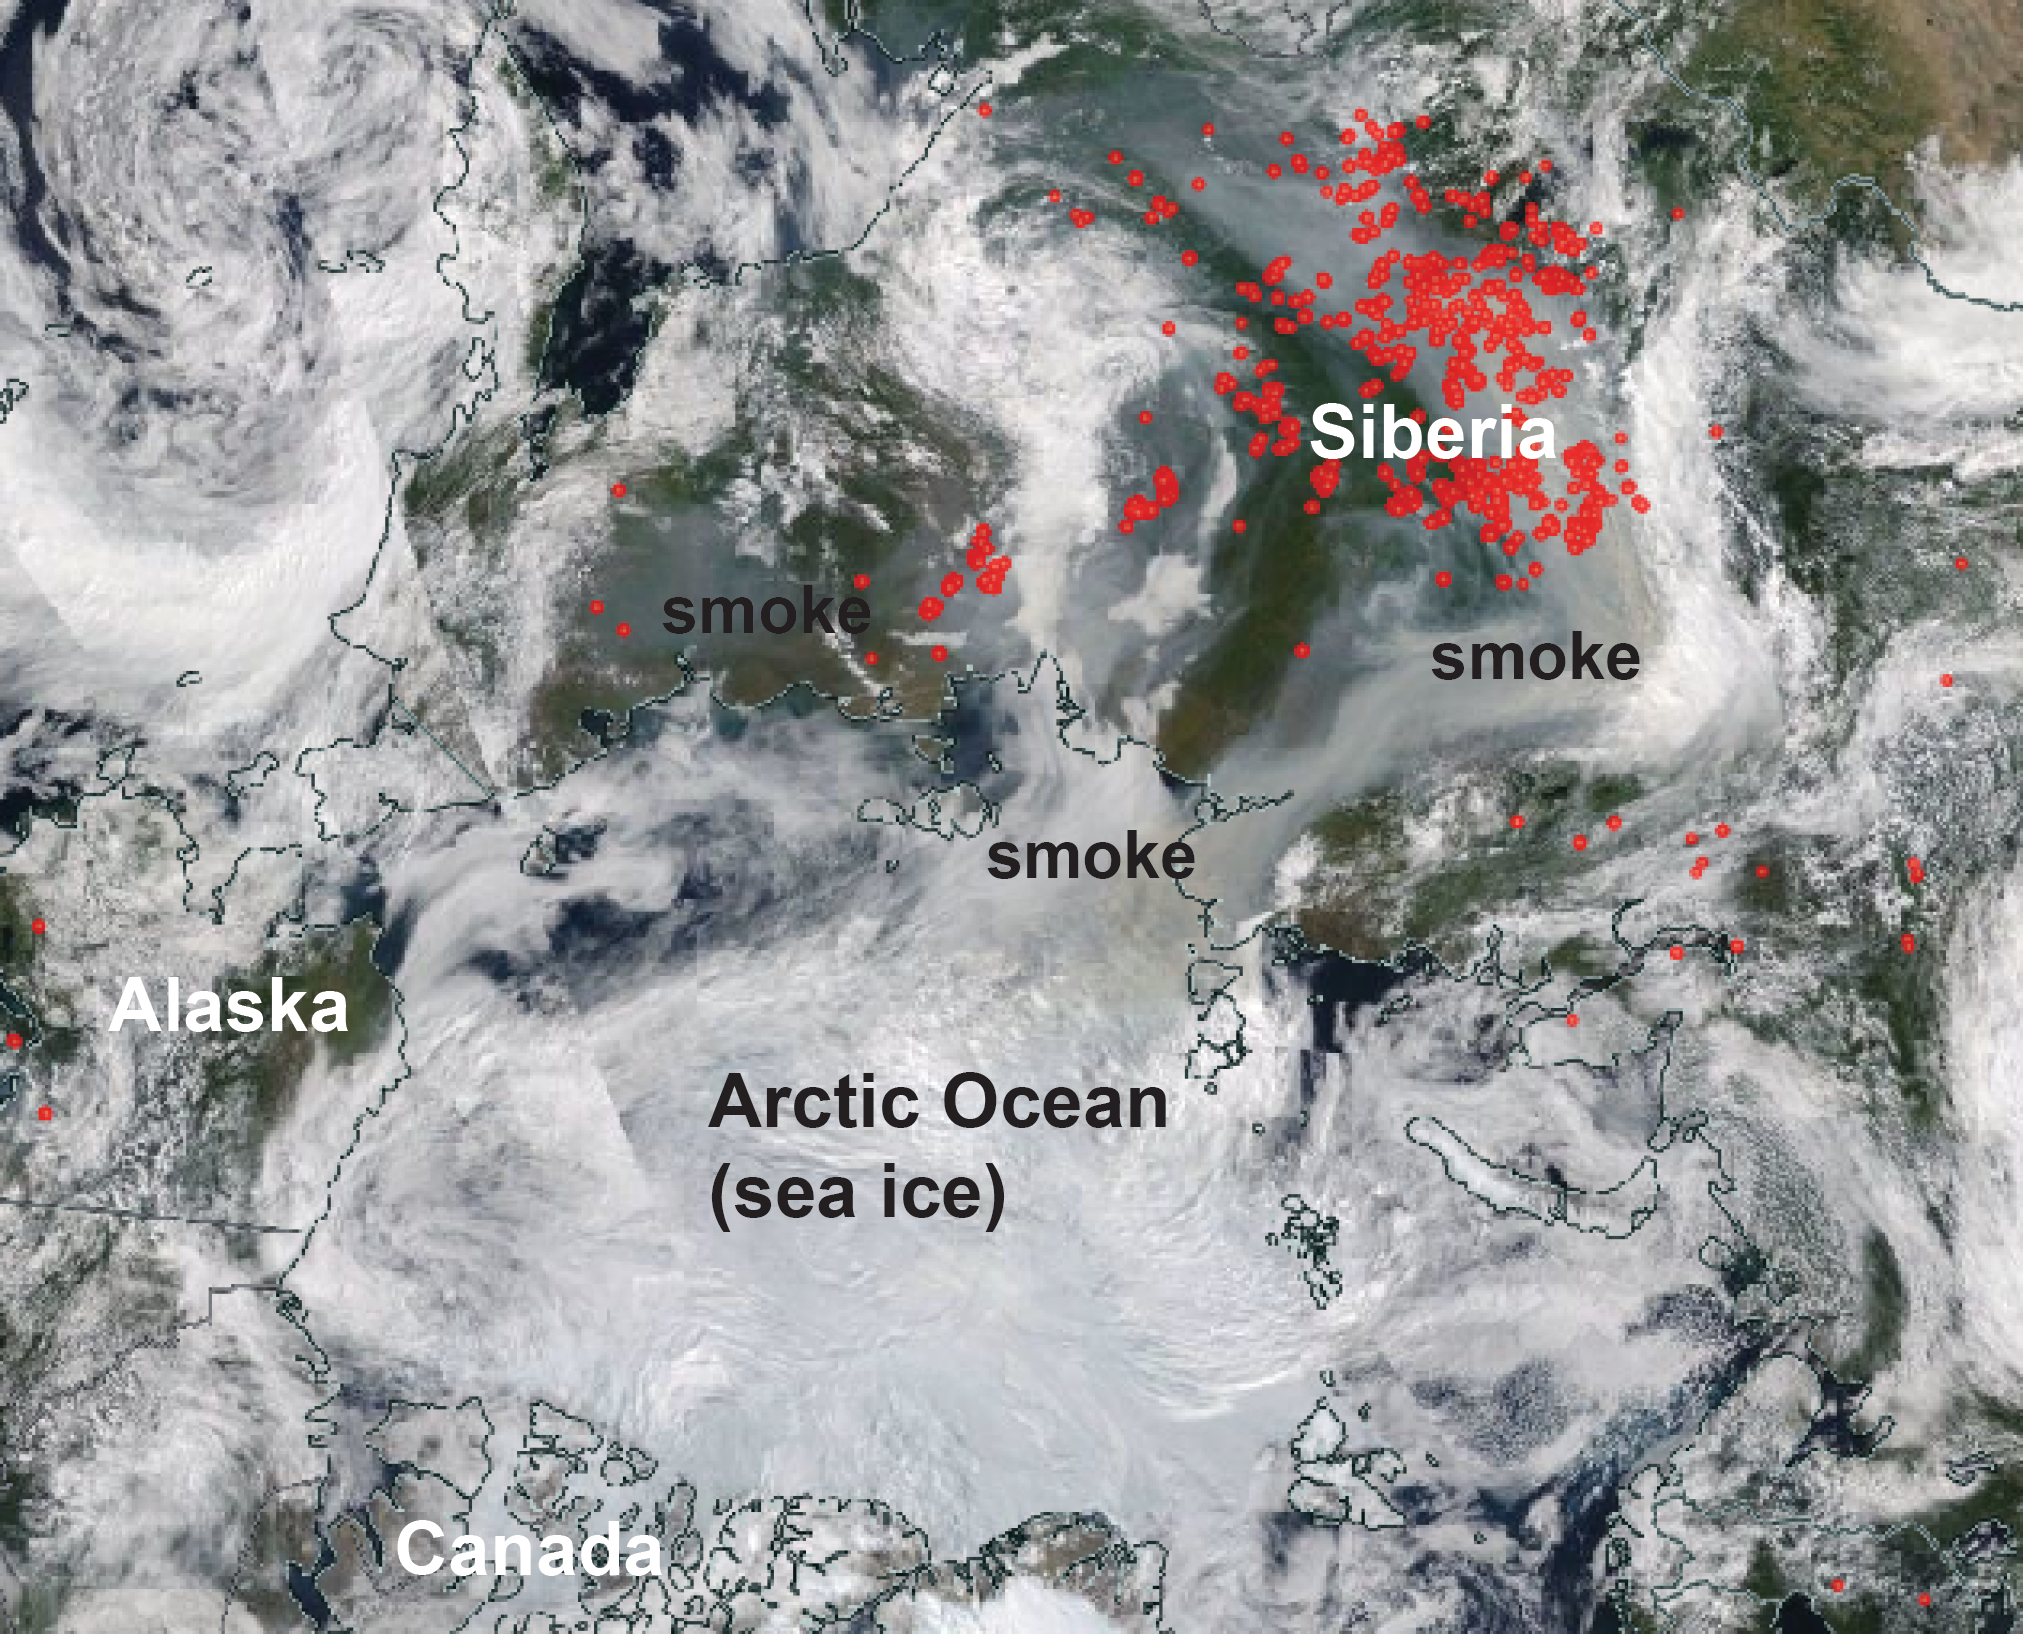
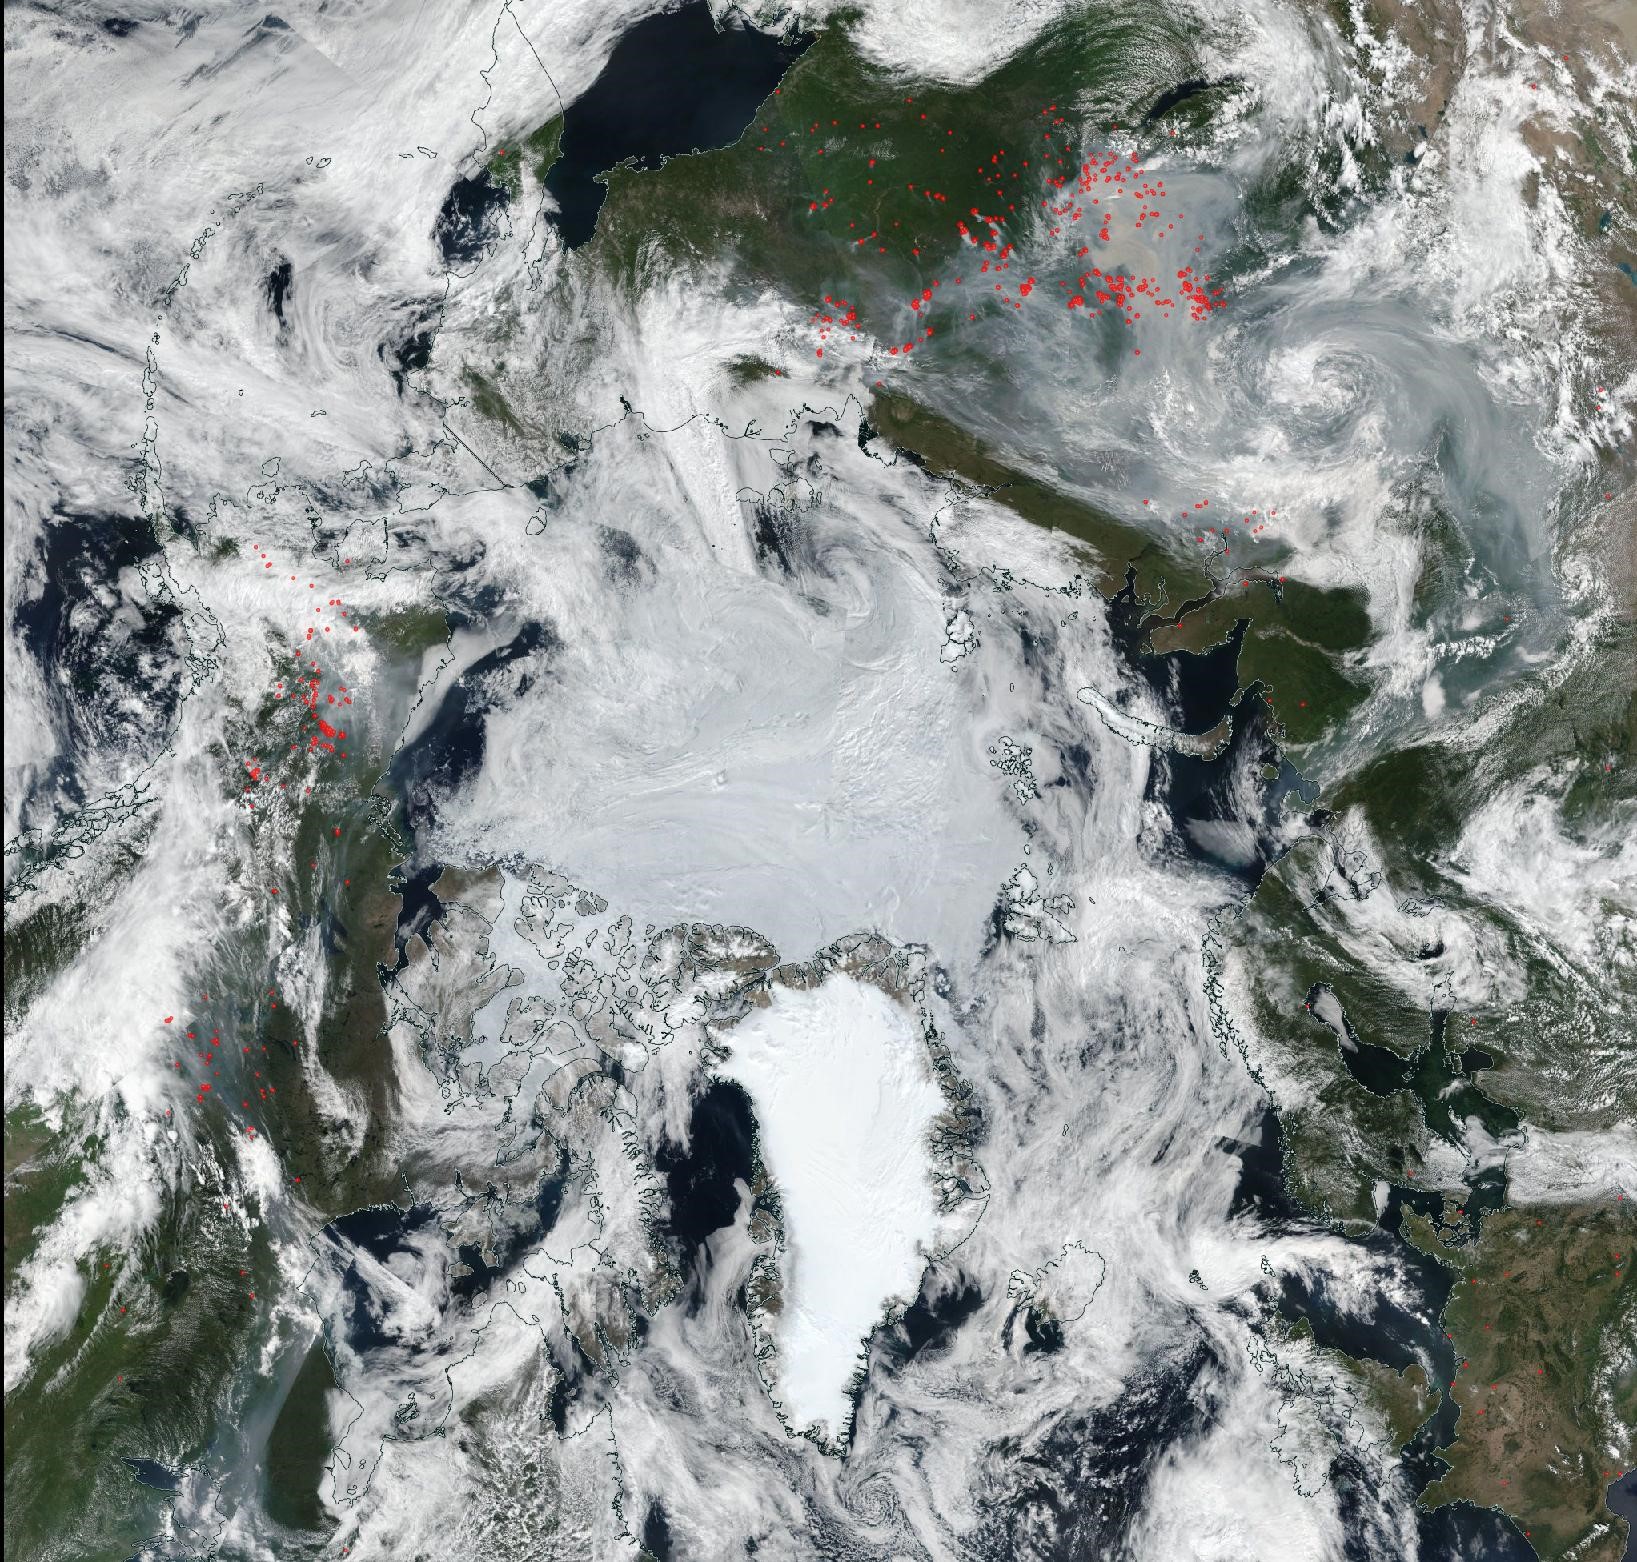
Figure 3. This NASA Worldview image from August 10, 2019, shows the locations of wildfires in the Arctic as detected by thermal images (not shown). Red areas indicate wildfires. Huge areas of burning forests in Siberia have filled the air with smoke over much of the Pacific side of the Arctic Ocean. This image was taken by the Moderate Resolution Imaging Spectroradiometer (MODIS) sensor on the NASA Terra satellite.
Credit: NASA Worldview
High-resolution image
Huge areas of burning forests in Siberia have filled the air with smoke over much of the Pacific side of the Arctic Ocean. However, at this late stage in the melt season, with rapidly declining solar input, it is unlikely to have much impact on sea ice loss. The fires are a result of the very warm and dry spring and summer conditions over the eastern Siberian Arctic.
There is such a thing as too thin
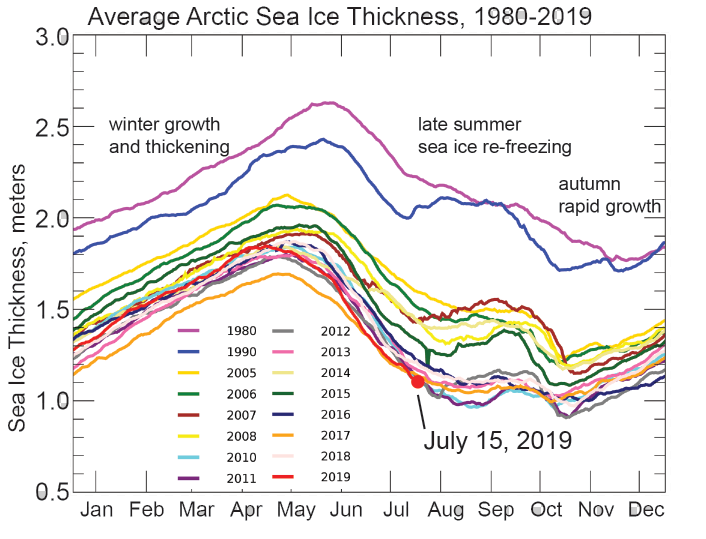
Figure 4a. This figure shows average Arctic sea ice thickness by month from 1980 t0 2019 as determined by the Pan-Arctic Ice Ocean Modeling and Assimilation System (PIOMAS).
Credit: Axel Schweiger, University of Washington
High-resolution image

Figure 4b. This map shows Arctic sea ice thickness in July 2019 as a difference from average (in meters), relative to 2011 to 2018, from the Pan-Arctic Ice Ocean Modeling and Assimilation System (PIOMAS).
Credit: Axel Schweiger, University of Washington
High-resolution image
Arctic sea ice volume, as estimated by a well-validated model produced by our colleagues at the University of Washington, is tracking at low levels as seen from satellite observations (Figure 4a). Arctic sea ice cover is thus very thin in addition to being very low in extent. Average Arctic sea ice thickness is estimated to be less than half of what it was at this time of year in 1980.
Sea ice thickness follows the change in the seasons. Early in the year, cold conditions and snowfall steadily thicken the sea ice. At the start of the melt season, typically in March, the thinner southern edges of sea ice cover melt first. Hence, the average thickness of the remaining sea ice increases, even though spring ice retreat has begun. By June, when much of the Arctic Ocean surface has reached the melting point, rapid thinning of the ice pack begins. Thickness and extent both reach a minimum in September. However, even though ice extent continues to decline through August, average sea ice thickness begins to increase slightly as the thinner ice at the edge melts away. Then, after the minimum extent, typically reached in mid-September, a rapid increase of sea ice extent begins, with thin sea ice covering large areas of the Arctic Ocean in a few weeks. This rapid increase of very thin ice reduces the average ice thickness, even though sea ice extent is increasing rapidly.
Is a new record minimum possible?
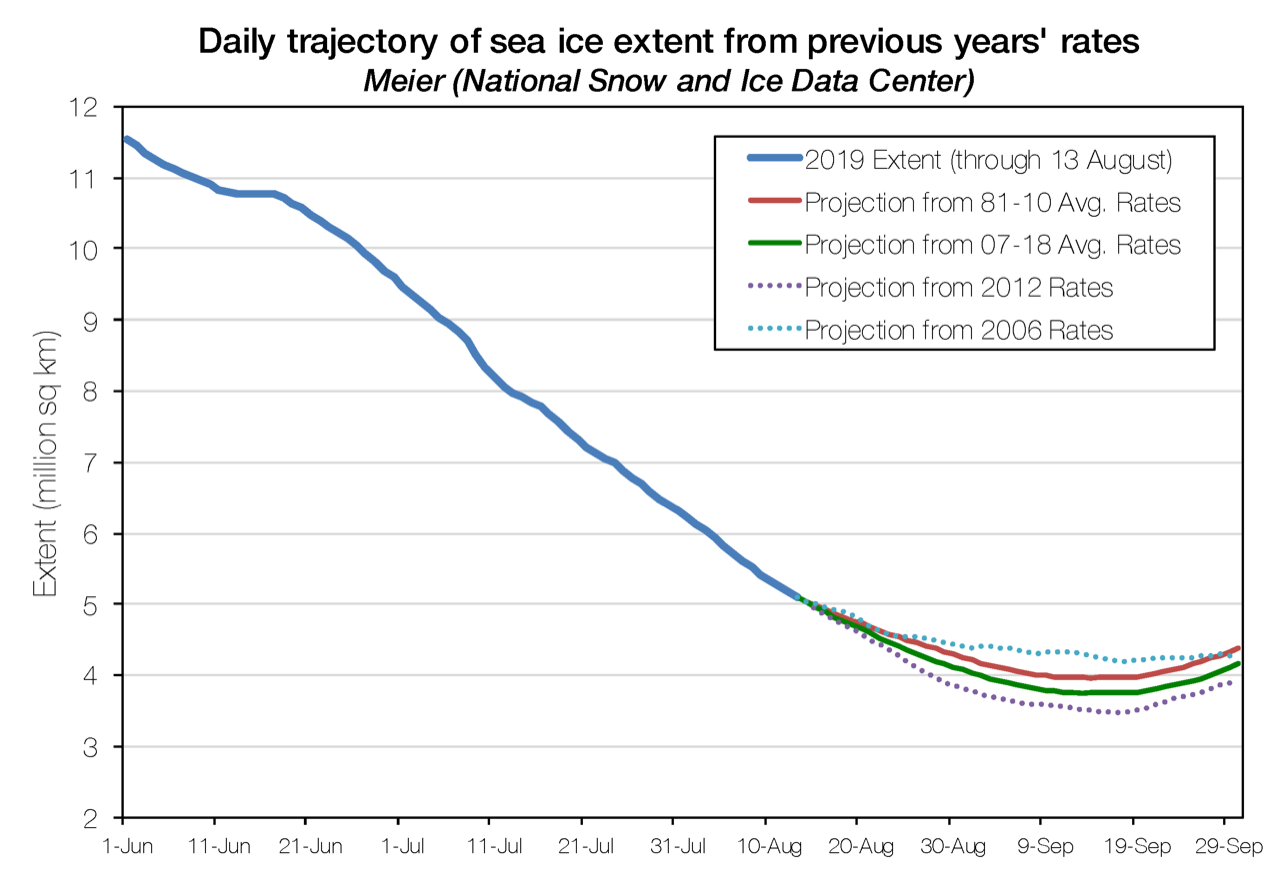
Figure 5. This figure compares 2019 projections of sea ice minimum extents based on rates of decline from previous years. The red line uses the rate of decline from the 1981 to 2010 reference period. The green line uses the rate of decline from 2007 to 2018 average. The dotted purple line uses the 2012 rate of decline and the dotted turquoise line uses the 2006 rate of decline.
Credit: Walt Meier, NSIDC
High-resolution image
The ASINA team conducted a revised analysis of the likely course of the 2019 Arctic summer sea ice minimum, using rates of loss from several recent years. While sea ice extent is now above extent for the same date in 2012, overall our projection for the minimum is lower than estimated in our previous post. Using the average decline rate of the past 12 years, from 2007 to 2018, the 2019 minimum is estimated to be 3.75 million square kilometers (1.45 million square miles). If the 2012 decline pattern is applied from August 14 forward, sea ice reaches 3.44 million square kilometers (1.33 million square miles). This is still above the 2012 summer minimum extent of 3.39 million square kilometers (1.31 million square miles). However, nearly all of the recent rates of sea ice loss lead to 2019 being second lowest in ice extent, surpassing 2007 and 2016.
Erratum
Readers alerted us to an error. On August 15, 2019, we reported that “Because 2012 is a leap year, and our tracking follows the day of the year, August 15 in 2012 is August 14 in non-leap years.” On August 26, 2019, we corrected this to say “August 13 in 2012 is August 14 in non-leap years.”


